March 2023
The World Happiness Report is out: what does it tell us about annual surveys?
The results of the biggest annual happiness survey in the world were released earlier this week: the 2023 World Happiness Report (WHR). It covers over 100 countries and ranks them by how happy their citizens are. Carrying out over 100 representative samples of national populations every year is a hugely complex statistical task. And are the results really that useful? I think it’s questionable.

The results of the biggest annual happiness survey in the world were released earlier this week: the 2023 World Happiness Report (WHR). It covers over 100 countries and ranks them by how happy their citizens are. Carrying out over 100 representative samples of national populations every year is a hugely complex statistical task. And are the results really that useful? I think it’s questionable.
And the winner is … (cue dramatic music)
Finland…
Except it all isn’t very dramatic…
Finland has won for the last six years!
Now, I have nothing against Finland winning. There is much to admire about this small nation; not least because they produced one of the most eccentric winners ever of Eurovision – Lordi, the mask-wearing heavy metal band! They also have hundreds of thousands of lakes. In fact, geographically they are 30% larger than the UK but have only 10% of the population.
They are one of the Nordic social democracies that has a strong social safety net. This undoubtedly reduces the sheer misery of being at the lower end of the income distribution. From a purely statistical perspective, reducing the unhappiness of the poorest sections of society improves overall average happiness levels. In fact, it is unlikely that Finns with above average income are much happier than similar people in the UK or the US. Instead, the British and Americans on lower income, are more likely to be unhappy than their Finnish equivalents.
Finland still has challenges, for example it has one of the highest levels of opioid use in Europe and its carbon emissions are highly unsustainable. This aside, all of the Nordics score well in the WHR as they are stable, equitable countries and people are undoubtedly happier in stable countries. The unhappiest countries of the world include nations with lots of instability such as Iraq, Iran, Turkey and Pakistan.
Economic and political stability is clearly good but it is almost as if the authors of the WHR are deliberately aiming for statistical stability too. In the report they say:
Life evaluations have continued to be remarkably resilient, with global averages in the COVID-19 years 2020-2022 just as high as those in the pre-pandemic years 2017-2019.
Notice their use here of the expression “life evaluations,” rather than happiness. This is because there is a huge fudge right at the heart of the WHR: the question they use to measure happiness itself. It is called the Cantril Ladder of Life. Respondents are asked to imagine a vertical ladder with their best possible life at the top and worst at the bottom. On average, Finns place themselves one rung higher than Brits on this measure.
Now the Cantril Ladder certainly measures something. But it is debatable whether it is happiness. Surely happiness is much more feeling based than this “life evaluation” measure? The issue the authors face is that this particular question has been thrust upon them by Gallup, who conduct the world poll behind the data. And this is the only comparable global survey there is. It places them in a conundrum but they plough along calling it happiness as they know if they called their report “The World Life Evaluation Report,” no one would take any notice of it!
They face another problem with the data: Gallup, presumably to save costs, only samples 1,000 people in each territory. Small samples like this aren’t very reliable, so results have to be presented as an average of the last three years. To be fair to the authors, they are very open about these statistical challenges, though I personally think it is a mistake to present results to three decimal places as it implies much more precision than the measures warrant.
Ultimately the WHR is of interest. It is just that the interest is limited. Probably the most valuable insight concerns the underlying drivers of good societies. These are identified as six key factors:
- Income (allowing for falling marginal returns on income)
- Health
- Social Support (such as having someone to rely on)
- Freedom to make life choices
- Generosity
- Low levels of corruption
The WHR can encourage nations to improve lives by working on these six factors but what it completely misses are the ups and downs of life. This is especially true over the last few years. I think for most of us life hasn’t felt at all stable during the pandemic. Instead, it has felt like an emotional roller coaster.
Look at the graph below. Isn’t this how it felt?
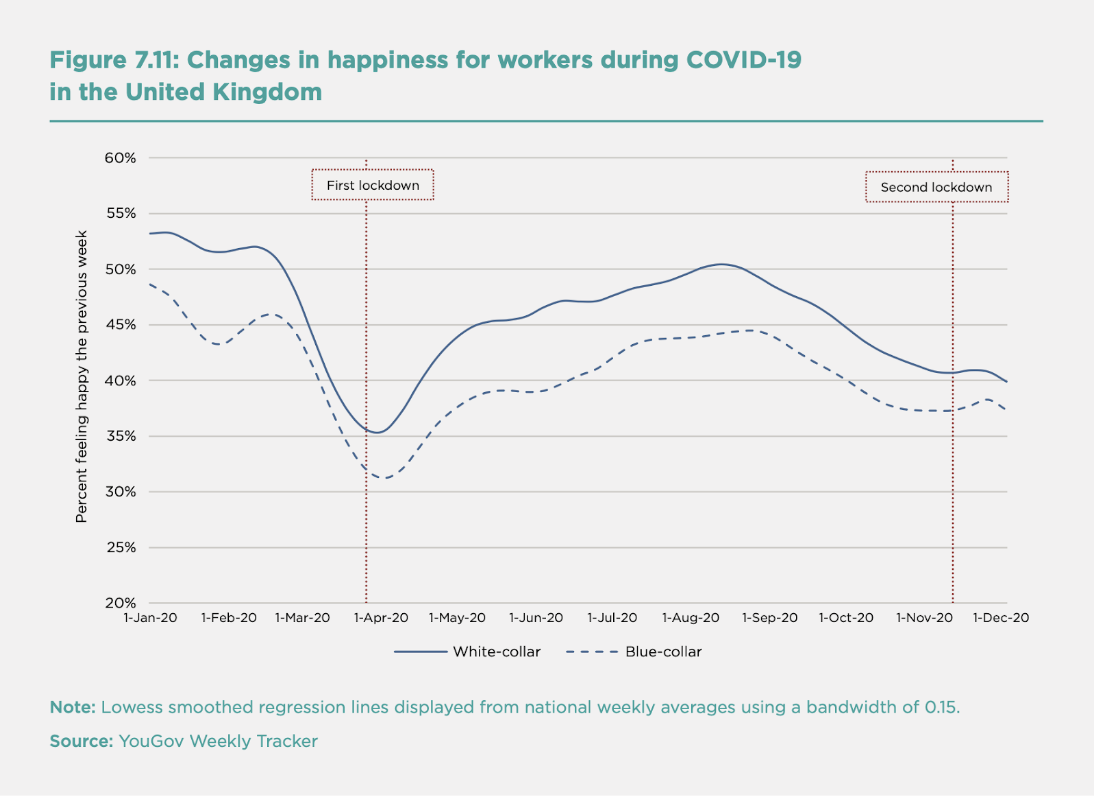
This is a graph of weekly happiness in the UK. It perfectly captures the ups and downs of the year. A normal start of the year with some winter blues in January and February. Then the huge shock of Covid-19. There was genuine fear in the air as we all worried about our ageing parents and grandparents. Then there was the disruption of work from home directives and lockdowns. Slowly we adjusted and by summer we were feeling a bit better. Then the next wave of covid struck and the sheer boredom and annoyance of more restrictions. It was a hard year.
Somewhat ironically, this graph is from the 2021 World Happiness Report! I am sure most people missed it though as it was buried on page 179! I was fascinated by it as although we have been tracking our clients’ weekly happiness for several years at Friday Pulse, I hadn’t realised that the UK polling company YouGov were tracking the weekly mood of the whole nation. Almost presciently they started the poll in July 2019. What struck me immediately was how perfectly the data shows that there were waves of happiness (and unhappiness), as well as waves of covid cases. Annual surveys, like WHR and most staff surveys, completely miss the ups and downs of life and work. They are just a snapshot in time and, in between, everyone is in the dark about what’s happening. In the modern business world they are of very limited value and often become much more of a tick box exercise than a real force for positive change.
In a recent survey of the UK workforce that we commissioned, over 70% of people who had done an annual staff survey felt it hadn't made any difference to their working life at all. In contrast, for those that did a consultative pulse survey, over 70% felt it did make a positive impact.
Doing a pulse survey that tracks weekly team happiness provides much more insightful data. Every week you can see how teams are doing, what is going well for them and what isn’t. Leaders can have better informed conversations with their teams. Support can be targeted where it is most needed.
In the 21st century, the world of work has become increasingly fast moving. Annual surveys simply can’t keep up. Like the WHR they will paint a picture of stability when in reality everything is much more fluid and dynamic. This is why at Friday Pulse we place such an emphasis on weekly measurement: then you have data that can be acted on immediately and which supports the process of building happy and successful teams.
Measure-Meet-Repeat
At Friday Pulse we seek to be disciplined and systematic in how we help our clients build happy, successful teams. We are acutely aware of the pressure that many of our clients and their teams are under. So, we have boiled down our measurement-led process to these essential elements:
Measure
Measurement kick-starts the process. Every week we ask team members how happy they were at work. The resulting data enables team happiness to be tracked across the organisation. We also give them the opportunity to share their successes, to thank colleagues, plus air any frustrations or ideas for improvement. This text-based data feeds into the next stage.
Meet
We encourage teams to meet every week to discuss their results. This is the step that many clients are concerned about, however it is the heart of the process. It is the opportunity for the team to come together, hear about each other’s successes and challenges. By reviewing together, Friday Pulse helps them build on what’s going well, understand what isn’t working and identify actions for the week ahead. If this step is skipped, then in our experience, response rates fall as team members feel like they are not being listened to.
Repeat
Maintaining momentum is critical for creating positive change. The consistency of meeting every week is how trust is built. Team members feel cared about and are able to share the responsibility for happiness at work. Slowly step-by-step new strategies and ways of working emerge. Communication, collaboration, and even creativity improve. Time inefficiencies are reduced. Overall performance improves.
Nic Marks
Find out more about how Friday Pulse can help you](https://fridaypulse.com/pricing-plans) and your team invest time wisely.

Get a free personal happiness report in just 2 minutes
Copyright © 2026 Friday Pulse.
Built with ♥ in London, UK.